Lobo Leap – UNM’s Defense Made Huge Strides in 2021
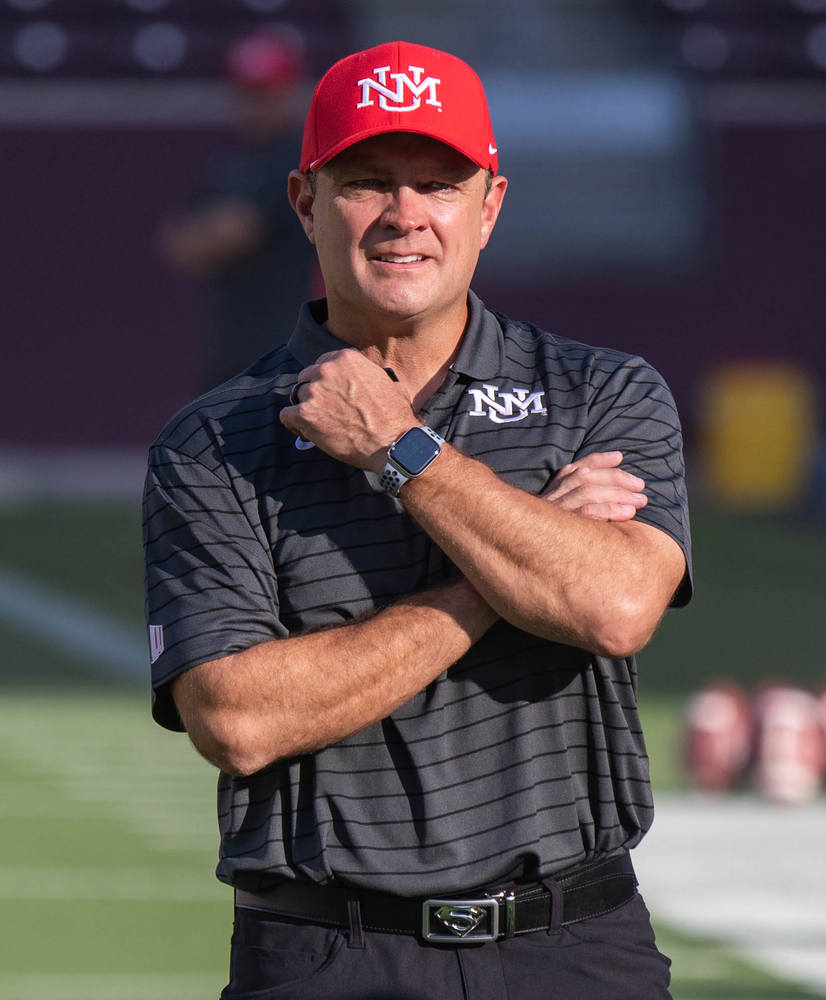
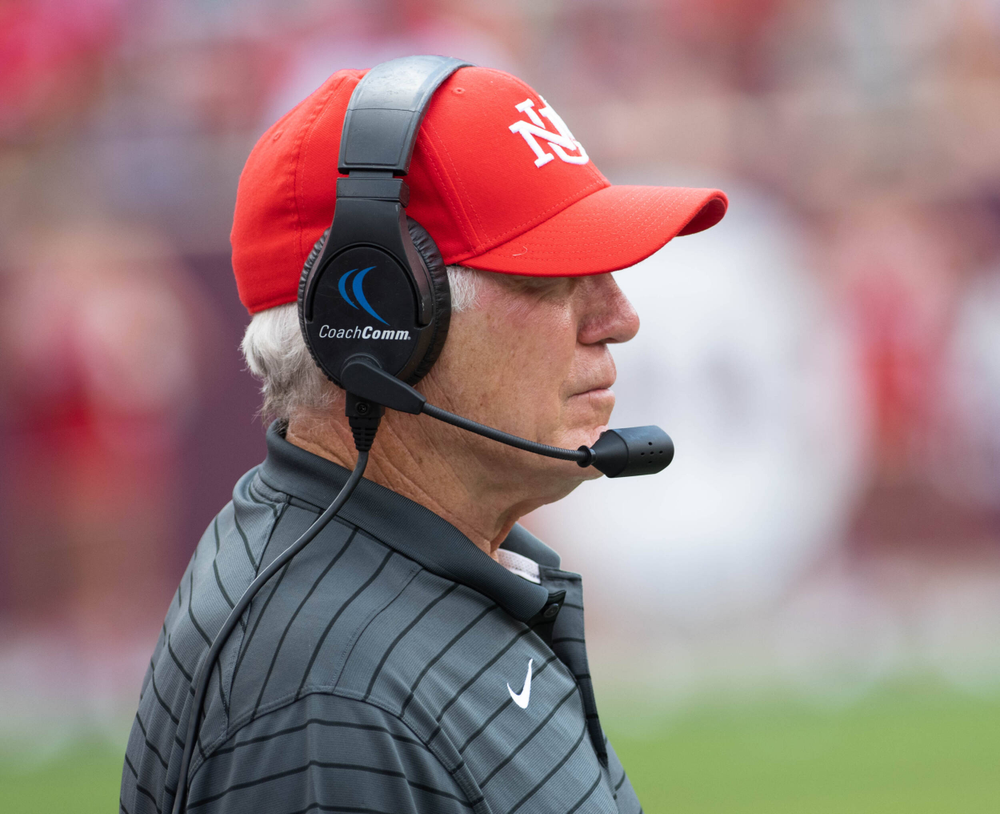
ALBUQUERQUE, N.M. — It took all of two years, but Head Coach Danny Gonzales has turned the Lobo defensive unit into a major strength heading into the 2022 spring season and beyond. The final NCAA Rankings are out, and UNM defense, coordinated by Rocky Long, ranked 44th overall in total defense, a 57-spot improvement from 2020.
Overall, UNM allowed 363.1 yards per game, and that is the lowest total in 13 seasons, since the 2008 team allowed 335.8 yards per game. UNM ranked 44th overall, and the 2008 team ranked 45th. This years’ ranking was the best since 2007, when UNM ranked 13th in total defense at 319.9 yards per game.
The Lobos rushing defense stood at 143.2 yards per game, better than a 20-yard per game improvement from 2020, and it is the best rushing defense since 2008 when UNM ranked 26th at 122.3 yards per game. Passing-wise, UNM allowed just 219.8 passing yards per game to rank 54th, an incredible adjustment from 2019 when the passing defense allowed 321.4 yards per game and ranked 130th (last) in the FBS. It was UNM’s best passing defense since 2010 when the unit ranked 53rd at 218.8 yards per game.
And UNM’s passing defense goes back further than last year. If you count the final four games of the 2020 season, when UNM allowed just 750 passing yards (a 187.5 average after allowing 1,231 yards, or 410.3 per game over the first three), the Lobos have allowed just 211.8 yards through the air over the last 16 games.
The common denominators of course are Gonzales and Long, who were here in 2008. Here is the chart of UNM’s defensive success this year, and UNM’s defensive numbers and rankings going back to 2007.

| Year | Total Defense (Rk) | Rushing Defense (Rk) | Passing Defense (Rk) |
| 2021 | 363.1 (44) | 143.2 (51) | 219.8 (54) |
| 2020 | 447.1 (101) | 164.1 (64) | 283.0 (116) |
| 2019 | 485.7 (129) | 164.3 (75) | 321.4 (130) |
| 2018 | 473.0 (119) | 217.0 (111) | 256.0 (104) |
| 2017 | 398.0 (70) | 157.4 (55) | 240.6 (88) |
| 2016 | 394.8 (56) | 172.5 (65) | 222.3 (59) |
| 2015 | 437.6 (97) | 192.7 (93) | 244.9 (92) |
| 2014 | 519.0 (124) | 269.0 (122) | 250.0 (92) |
| 2013 | 516.6 (119) | 257.2 (120) | 259.4 (101) |
| 2012 | 444.2 (97) | 174.9 (73) | 269.2 (103) |
| 2011 | 492.1 (118) | 246.9 (119) | 245.2 (87) |
| 2010 | 469.0 (119) | 250.2 (117) | 218.8 (53) |
| 2009 | 418.7 (100) | 165.0 (83) | 253.7 (105) |
| 2008 | 335.8 (45) | 122.3 (26) | 213.5 (70) |
| 2007 | 319.9 (13) | 122.5 (26) | 197.4 (20) |
Year Total Defense (Rk) Rushing Defense (Rk) Passing Defense (Rk)
2021 363.1 (44) 143.2 (51) 219.8 (54)
2020 447.1 (101) 164.1 (64) 283.0 (116)
2019 485.7 (129) 164.3 (75) 321.4 (130)
2018 473.0 (119) 217.0 (111) 256.0 (104)
2017 398.0 (70) 157.4 (55) 240.6 (88)
2016 394.8 (56) 172.5 (65) 222.3 (59)
2015 437.6 (97) 192.7 (93) 244.9 (92)
2014 519.0 (124) 269.0 (122) 250.0 (92)
2013 516.6 (119) 257.2 (120) 259.4 (101)
2012 444.2 (97) 174.9 (73) 269.2 (103)
2011 492.1 (118) 246.9 (119) 245.2 (87)
2010 469.0 (119) 250.2 (117) 218.8 (53)
2009 418.7 (100) 165.0 (83) 253.7 (105)
2008 335.8 (45) 122.3 (26) 213.5 (70)
2007 319.9 (13) 122.5 (26) 197.4 (20)
The Lobos defensively saw improvements not just in the yards and rankings. No, they had plenty of other major improvements. Along with the passing yards, the teams’ passing efficiency defense was greatly improved as well. UNM opponents had a 131.99 passer rating, ranking 59th in the country. Last year UNM ranked 120th allowing opponents to pass at a 162.92 clip.
The Lobos also averaged 5.3 team tackles for a loss, besting the 4.6 last year, an improvement of 29 slots up to 81. UNM also improved 19 slots in both third-down defensive conversion percentage and total first downs allowed.
The Lobos individually had several big improvements, the biggest on special teams. Punter Aaron Rodriguez averaged 42.8 yards per punt, ranking 44th, one year after UNM averaged 40.4 yards per punt (Tyson Dyer) who ranked 72nd. Luke Wysong ranked among the national leaders in total kickoff returns (65th), punt return touchdowns (5th) and kickoff returns (54th). Joey Noble ranked fourth nationally in TFLs per game.
The Lobos saw most of that improvement despite seven starters playing on the same defense two years ago in 2019 (Langston Murray, Joey Noble, Reco Hannah, Devin Sanders, Corey Hightower, Jerrick Reed II and Donte Martin.
UNM enters the 2022 season with returning starters Jerrick Reed II, Jake Saltonstall, Syaire Riley, Ray Leutele, Reco Hannah, Ronald Wilson and Tavian Combs, plus plenty of other contributors and redshirts that bodes well for continued improvement on the defensive side of the ball.


